Chapter 3 Data transformation
3.1 The Columns We Chose From Listings.csv
After we downloaded the CSV file, we processed it first directly in excel as it is a great way to look for every column we had. We chose to keep: id,host_id,host_since,host_response_rate,host_acceptance_rate, host_listings_count, host_has_profile_pic, host_identity_verified, neighbourhood_group, latitude, longitude, room_type, accommodates, price, availability_30, availability_365, number_of_reviews, last_review, review_scores_rating, review_scores_accuracy, review_scores_cleanliness, review_scores_checkin, review_scores_communication, review_scores_location, review_scores_value, and reviews_per_month as these variables might be meaningful for our further analysis.
The brief understanding of the data is that there are 44187 Airbnb properties collected in this dataset and 26 features that we chose can be grouped into three feature groups: property information, host information, review information
Property information (10 features): id, host_since, neighbourhood_group, latitude, longitude, room_type, accomodates, price, availability_30, availability_365.
Host information (6 features): host_id, host_response_rate, host_acceptance_rate, host_listings_count, host_has_profile_pic, host_identity_verified.
Review information (10 features): number_of_review, last_review, review_scores_rating, review_scores_accuracy, review_scores_cleanliness, review_scores_checkin, review_scores_communication, review_scores_location, review_scores_value, review_per_month.
3.2 The year_bar Dataset
For the year_bar.csv file, we transform the hosts’ registration data from the host_since column in order to see how Airbnb’s hosting members grow over the years. We grouped the data by different boroughs then pivot the dataset wider so we have data filtered out for every year since 2008. We will use this dataset for our interactive bar chart in part 6.
Let’s see the dataset:
## # A tibble: 13 x 7
##     year Bronx Brooklyn Manhattan Queens Staten_Island Total
##    <dbl> <dbl>    <dbl>     <dbl>  <dbl>         <dbl> <dbl>
##  1  2008     0       15         7      2             0    24
##  2  2009     1      138        99     14             3   255
##  3  2010    25      427       320     43             4   819
##  4  2011    23     1215       895    111            10  2254
##  5  2012    40     1966      1658    262            20  3946
##  6  2013    58     2283      2290    352            13  4996
##  7  2014   108     2771      3001    599            27  6506
##  8  2015   100     2800      3211    745            33  6889
##  9  2016   158     2065      2596    758            52  5629
## 10  2017   187     1299      1489    768            46  3789
## 11  2018   180     1111      1335    710            45  3381
## 12  2019   197     1213      2073    768            43  4294
## 13  2020    72      433       606    265            12  1388
3.3 Data manipulation
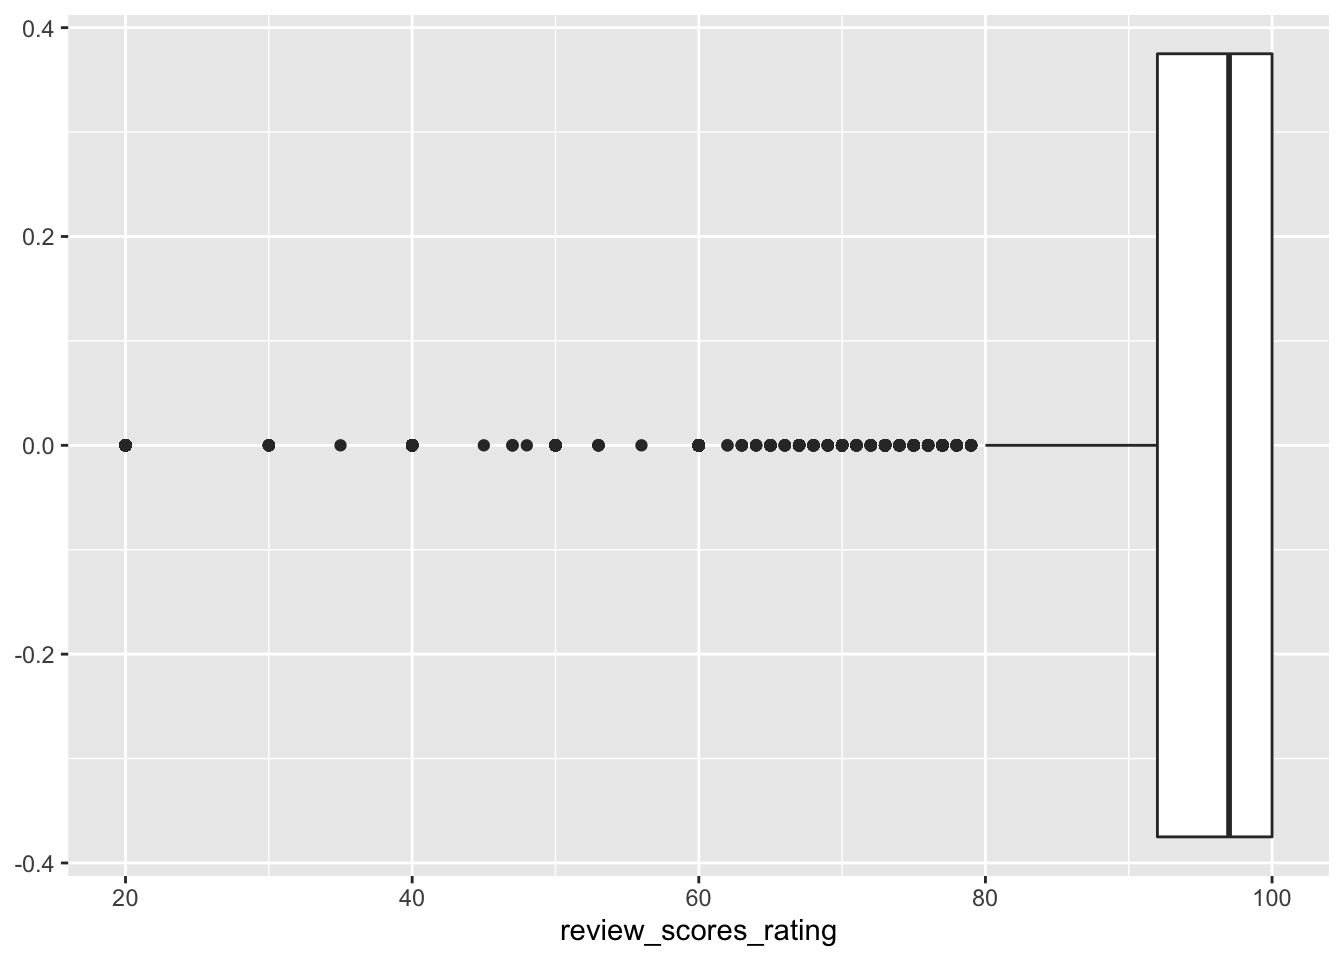
To conduct further analysis and visualizations, we filtered the price variable into three levels “Expensive”, “Medium”, and “Budget”. We define any property that has a price higher or equal to $160 as an expensive Airbnb listing. The medium price level is from $65 to $159. The budget properties are those cheaper than $65. Meanwhile, we also separated the review_scores_rating variable into three levels, “Excellent”, “Poor”, and “Good”. The definition of an excellent property is that the listing received an overall score rating of 100. We defined the scores from 92 to 99 to be good review scores. Lastly, those properties that received a review rating of less than 92 are poor reviews. We separated three levels of these two variables according to their interquartile ranges.
Price:
## 25% 75%
##  65 160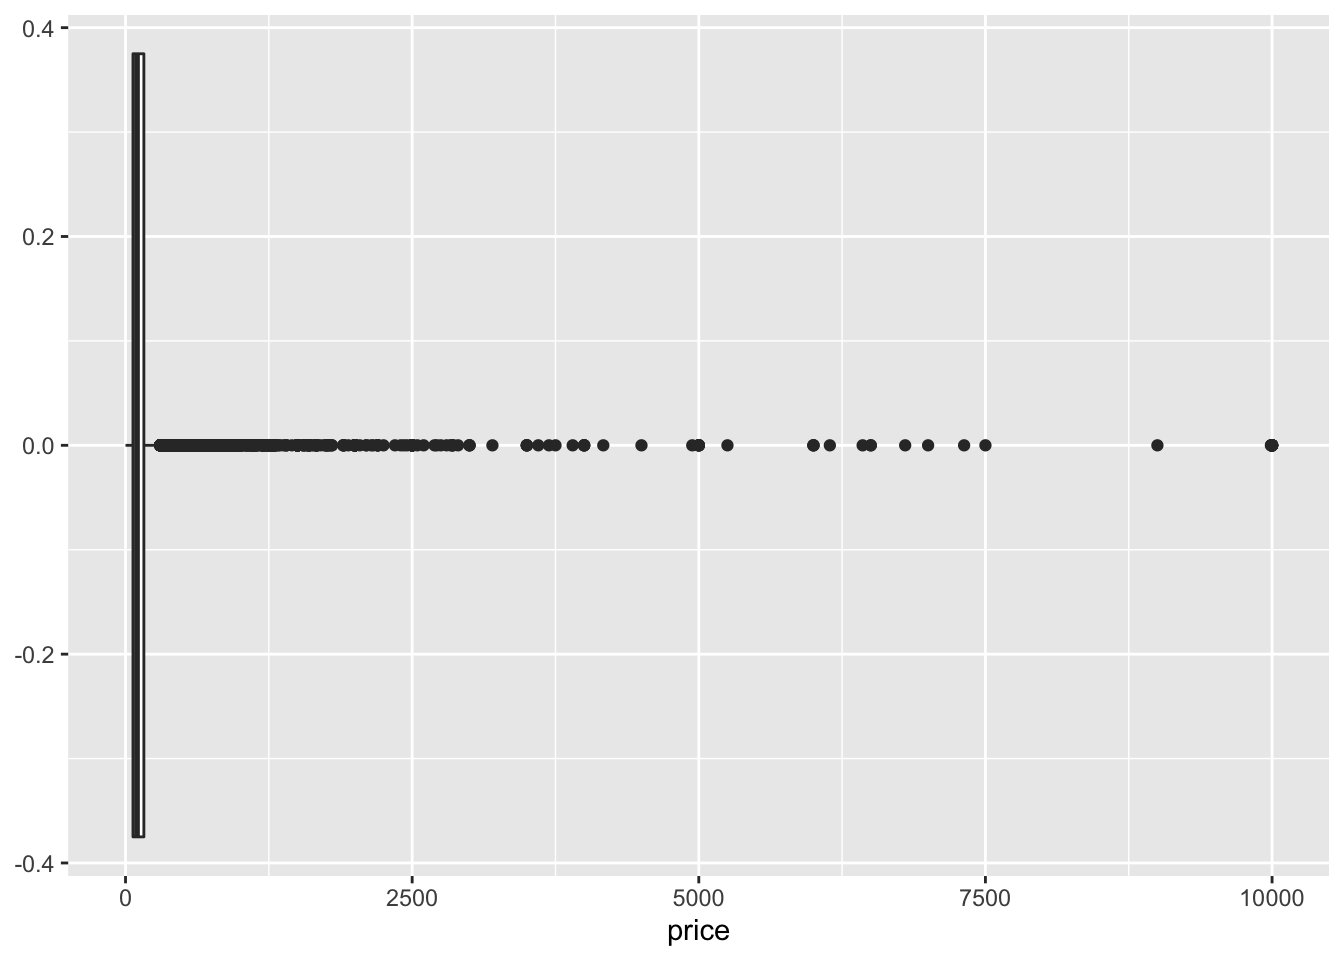
Overall review scores:
## 25% 75%
##  92 100